
We are technology enthusiasts, and we state that software is at the core of how we make BIM accessible for all. But beyond our phrases, there’s a lot of information waiting to be interpreted and told.
It’s like a watch. What we see on our wrists is the result of a series of smaller processes that make the handles move and let us know what time it is. Are you going to tell me that what lies behind the numbers and handles isn’t interesting to you?
What’s behind many of the things we do is Dynamo. But before getting specific about it, we should see the bigger picture.
Programming, a matter of relationships
Design is all about relationships. Think of colors, textures, geometric shapes, etcetera. They all make part of one greater design. In programming, at the time of designing you also have relationships.
Those relationships will be the ones that turn different actions into results by performing different mathematical and logical operations or algorithms.
Explaining algorithms through a cake
When you think about algorithms the first thing that might come to mind is Google anticipating your words in the search bar. And while that seems like magic or mind-reading, it absolutely isn’t. Let’s use a cake to illustrate that point.
The cake is the result we see, and the algorithm is all the steps required to make it. Now, you can follow a written recipe and break some eggs, use flour, chocolate, etcetera. I mean, following the steps as they are written in order.
But another way you can bake the same cake is through graphic instructions. Think of them as the same steps of the recipe but instead of written, they are images that illustrate the process step by step.
Either way, following graphic or text instructions, should lead to the same result, a cake. Sticking to those instructions is applying an algorithm. Now, the way you read that set of instructions can be different, and that takes us to programming.
Beginners guide to programming
Let’s say that you want to formalize the actions of that process and turn them into an executable program. If you did so and a computer could follow those instructions and actually bake a cake, you would be programming.
Of course, the way that executable programs are created relies on programming languages. There are different ones: Python, C, JavaScript, etc. Being able to formalize that set of instructions eliminates the chance of human error and allows us to conduct an operation several times with less manual effort.
But it’s how we choose to formalize those actions that matter here. If you decided to go with graphics, then what you are looking for is visual programming.
What's visual programming?
Visual programming consists in tying nods together. It’s highly visual (of course) so it’s appealing for designers who find it easier to connect nodes this way than to code using text. And here’s where Dynamo comes into the picture.
Dynamo, a tool for every need
Let’s start from the beginning. Dynamo is an application, and it can be downloaded to be used as a plug-in for Autodesk’s software (and even Web APIs). Of course, despite how you use it, it’s a great tool to dive into the visual programming world.
When you run it, you will see that you have the chance to connect different nodes to define sequences of actions that, ultimately, become custom algorithms that can serve different purposes.
Also, as stated before, Dynamo is oriented towards designers. In order to be appealing to them, it offers the possibility to use elements from external libraries or Autodesk products that have an API.
Let’s break it down a little bit more. Shall we?
Nodes, ports, and states
If I had to explain it in a few words, I would say that nodes are the elements that perform operations and that you connect with each other to program a Visual Program. From simple math operations to creating geometry, nodes are central in the functioning of Dynamo.
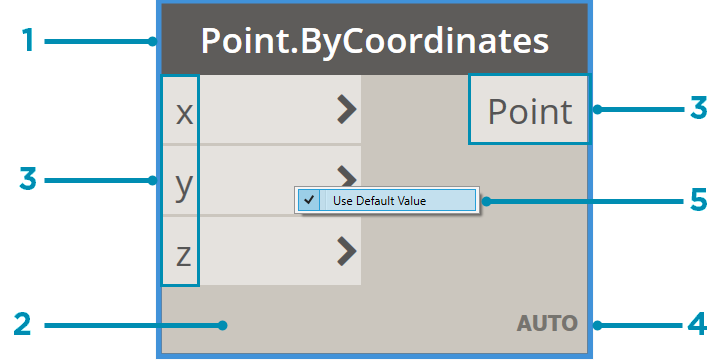
Nodes are composed of five different elements.
- The node’s name
- The node’s ports. They receive the wires that transmit the data to the node and then also serve as conduits to transmit information to other nodes.
- The node’s main part. If you right-click it you will get access to different options regarding the entirety of the node.
- The node’s default value. To access it, you have to right-click on an input port or just put your pointer on the input port to see which kind of output are you going to obtain.
- The lacing icon. It indicates the lacing option that you set for matching list inputs.
Let’s keep going. We’ve previously established that the ports are the ones that receive inputs from Wires. Now, those inputs enter the node from the left ports and their outputs from the right ones. But this doesn’t mean that they can receive any type of input. The information that enters the node from the left must be linked to the data the node contains.
Finally, we have reached the states. You will learn that they come in different colors, and there’s a reason why. Dynamo changes the colors of the nodes according to their status. What is their status?
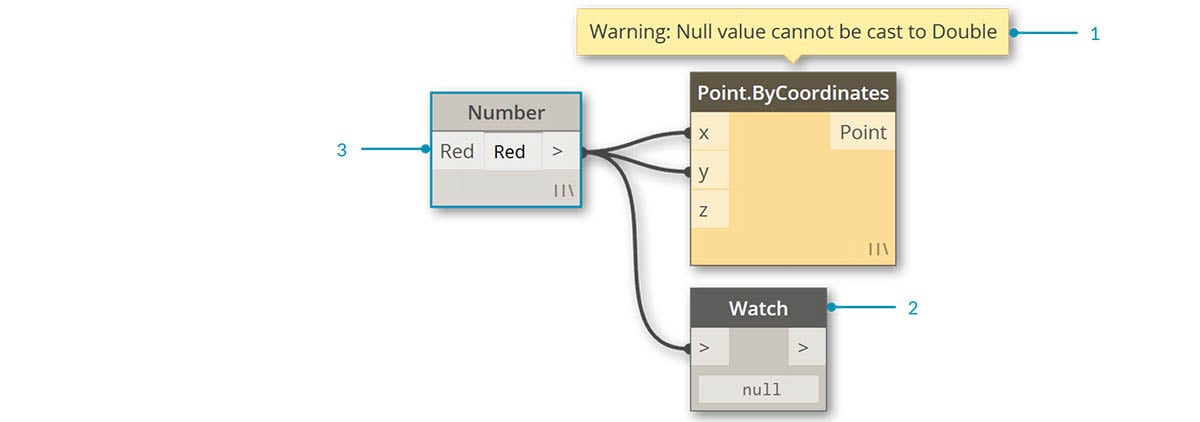
- An error state makes the node become red.
- A warning state makes the node color yellow.
- An inactive state (nodes not being connected to a wire) makes the node color grey.
- An active state (nodes connected to wires) turns the name background dark grey.
- A frozen state makes the node transparent.
- A selected state makes the node’s border color aqua.
- A background preview makes the node turn dark grey.
What about wires?
We couldn’t avoid talking about wires! They are the ones that transfer information from one node to another or, to put it differently, they determine the visual program’s flow.
What I mean by flow is the way data passes through the different nodes in the process of execution of operations. But, as you might have guessed by now, the flow tends to go from left to right. Why? Because input ports are located on the left side of the node and the output ones are located on their right.
Now, how do you create these wires? Easy. You just have to left-click on the output port of a node and a wire will appear dashed until you left-click on the input port of another node, creating a connection.
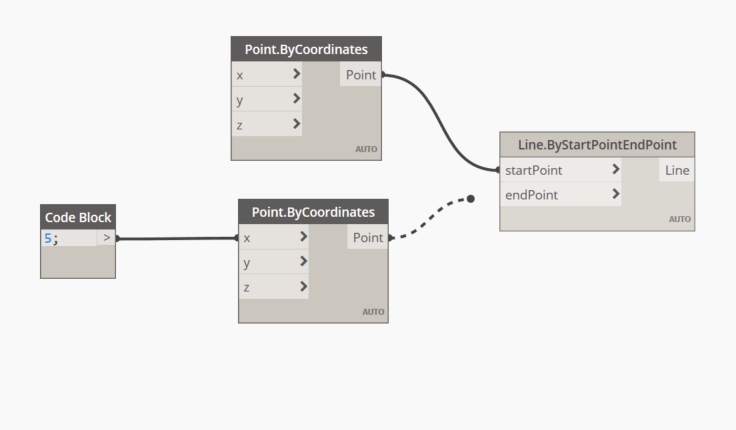
But you can make a mistake, everyone does. That’s when you have to edit them. In order to do so, you have to click on the input port that is already connected and then on a clean area of your working space to successfully disconnect the wire.
It’s time to implement visual programming into your workflow!
Visual programming has many things to offer to the AEC world. Not only in terms of design and modeling but also in workflows and decision-making processes. Software is at the core of how we make BIM for all, and we believe that without taking risks and hopping into the technological revolution train, companies are set to be left behind. Contact our experts now and learn more about Dynamo!